
A Guide to Digital Shelf Metrics for Consumer Brands
- Jul 16
- 11 min read
A shopper searches for your product on Amazon, Walmart, Instacart, Target, or another online marketplace.
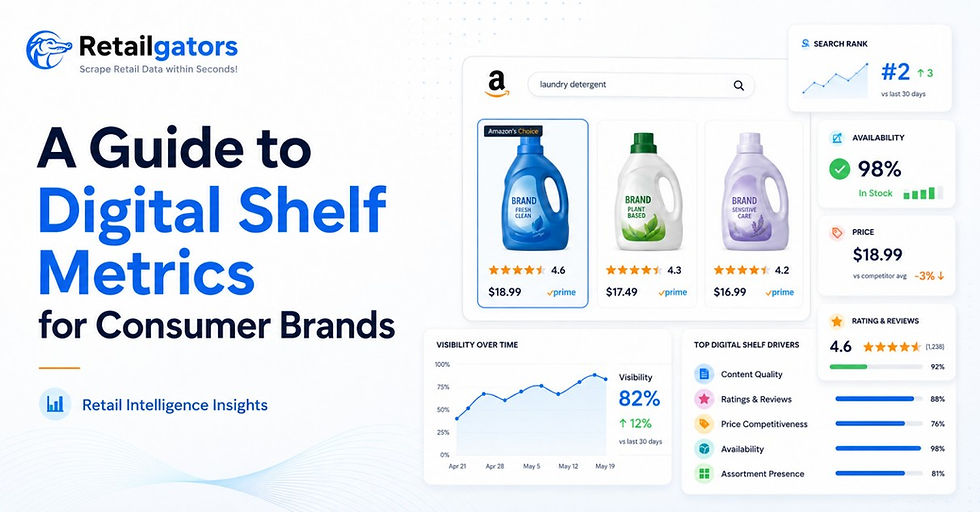
Your brand is listed somewhere on the page. Maybe it appears near the top. Maybe it is buried below five competitors. Maybe the product image is outdated. Maybe the price is higher than expected. Maybe the item is out of stock in one ZIP code but available in another. Maybe the product page has three-star reviews because customers keep complaining about missing size information.
From the customer’s point of view, this whole decision takes a few seconds.
From the brand’s point of view, it can decide whether a product gets clicked, compared, added to cart, or completely ignored.
That is why digital shelf metrics matter.
For consumer brands, the digital shelf is no longer just an online product listing. It is the place where visibility, pricing, content, reviews, availability, and competitor positioning come together. If one of those pieces breaks, sales can drop quietly before anyone notices.
A strong digital shelf strategy helps brands answer one important question: “Are our products showing up in the right place, with the right content, at the right price, and in a way that makes customers confident enough to buy?”
To answer that properly, you need the right digital shelf metrics.
What Are Digital Shelf Metrics?
Digital shelf metrics are performance indicators that show how your products are performing across ecommerce platforms, marketplaces, retailer websites, and digital retail channels.
They help brands measure things like product visibility, search ranking, pricing accuracy, content quality, stock availability, customer sentiment, promotional activity, and assortment gaps.
In simple words, these metrics show whether your products are easy to find, easy to trust, and easy to buy online.
A brand may have a great product, a strong retail network, and a solid pricing strategy. But if the product is not visible on marketplace search results, has weak images, inaccurate descriptions, poor ratings, or frequent stockouts, it will lose sales to competitors that manage the digital shelf better.
This is where Digital Shelf Analytics becomes important. It gives ecommerce, category, pricing, and retail intelligence teams a structured way to monitor online performance instead of relying on manual checks or delayed reports.
Why Consumer Brands Cannot Ignore the Digital Shelf
A few years ago, many consumer brands still treated ecommerce as a secondary sales channel. Retail stores were the main battlefield. Online listings were just another place to display products.
That has changed.
Today, customers compare products across marketplaces, brand websites, delivery apps, and retailer platforms before making a purchase. Even if they buy offline, their discovery often starts online. They check prices. They read reviews. They compare pack sizes. They look at images. They search by category, need, ingredient, use case, or brand name.
For example, imagine a personal care brand selling a shampoo range across multiple marketplaces. The product is available on Amazon, Walmart, a grocery delivery platform, and the brand’s own website.
On Amazon, the product appears on page two for “anti-dandruff shampoo.” On Walmart, the main product image is missing. On the grocery app, the price is higher than a competitor’s similar product. In one region, the product is out of stock for three days. On another platform, the title does not include the key benefit customers are searching for.
None of these issues may look huge in isolation. Together, they can quietly reduce visibility, traffic, conversions, and market share.
That is the real challenge. Digital shelf issues are often small, scattered, and easy to miss. But they affect revenue every day.
The Core Digital Shelf Metrics Every Brand Should Track
Every brand does not need to track every metric from day one. The right metrics depend on your category, channel mix, product portfolio, and business goals. Still, there are some core areas that most consumer brands should watch closely.
1. Share of Search
Share of Search tells you how often your products appear in search results compared to competitors for important keywords.
If a shopper searches for “organic baby cereal,” “wireless earbuds,” “protein powder,” or “men’s running shoes,” where does your product appear? Is it on the first page? Is it above competing brands? Is it visible organically, or only through sponsored placements?
This metric matters because most shoppers do not scroll endlessly. If your product is not visible where customers are searching, your brand is already losing opportunities.
Share of Search helps teams understand:
Which keywords your brand owns
Which search terms competitors dominate
Where your products are losing visibility
Whether sponsored ads are improving shelf presence
How visibility changes across retailers and regions
For category managers, this is especially useful. If a competitor keeps gaining visibility for high-intent terms, it may not be just an advertising issue. It could be stronger content, better ratings, better availability, or aggressive pricing.
That is why Share of Search should not be viewed in isolation. It connects directly with content, reviews, inventory, and pricing.
2. Product Content Quality
Product content is one of the most underestimated digital shelf metrics.
A product title, image, description, bullet points, specifications, size details, ingredients, dimensions, and usage instructions all influence how customers understand the product. Weak content creates confusion. Confusion slows down buying decisions.
This is where Content Analytics plays a practical role. It helps brands check whether their product pages are complete, accurate, compliant, and optimized across different platforms.
For example, a home appliance brand may discover that its blender has different wattage details across three retail websites. A beauty brand may find that one marketplace is showing an outdated product image. A grocery brand may notice that pack size information is missing, causing customers to compare the wrong products.
These content gaps can damage trust. They can also affect search ranking because marketplace algorithms often depend on product titles, attributes, and structured details.
Good content metrics usually track:
Title completeness
Image availability and quality
Bullet point coverage
Description accuracy
Attribute completeness
Brand guideline compliance
Missing or incorrect product details
Content consistency across retailers
In ecommerce, content is not just decoration. It is part of the sales process.
3. Pricing and Promotion Metrics
Price is one of the first things customers notice. It is also one of the most dynamic parts of the digital shelf.
Brands need to know how their prices compare against competitors, whether retailers are following agreed pricing rules, how discounts are being displayed, and whether promotional activity is consistent across channels.
A small pricing difference can matter a lot in categories like electronics, grocery, personal care, beauty, fashion, and consumer packaged goods. In some categories, customers are highly price-sensitive. In others, pricing affects brand perception more than immediate conversion.
Useful pricing metrics include:
Current selling price
Discount percentage
Original price vs sale price
Price changes over time
Competitor price difference
Promotional frequency
Seller-level pricing
Regional price variation
MAP violations, where relevant
Let’s say a consumer electronics brand launches a campaign for a smartwatch. The official promotion is 15% off. But one marketplace seller is offering 25% off, while another retailer is showing the old price with no discount. A competitor drops its price during the same week.
Without price monitoring, the brand may only notice the impact later in sales reports. With proper digital shelf tracking, the team can see what is happening while it is still happening.
4. Product Availability and Stock Status
Visibility means very little if the product is not available to buy.
Availability metrics show whether products are in stock, out of stock, low in stock, or unavailable in specific regions, stores, ZIP codes, or marketplaces.
This is one of the most painful issues for ecommerce teams. A product may be ranking well. The content may be strong. The price may be competitive. But if it is out of stock during a demand spike, the sale goes to someone else.
Worse, repeated stockouts can hurt search ranking and customer trust.
Availability metrics help answer questions like:
Which products are frequently going out of stock?
Which retailers have the lowest availability rate?
Are stockouts happening in specific regions?
How long does it take to recover from out-of-stock events?
Are competitors gaining visibility when your products are unavailable?
For FMCG, grocery, health, beauty, and household brands, availability is often one of the most important digital shelf metrics. Customers do not wait long. If their preferred brand is unavailable, they may try another product. Sometimes, that switch becomes permanent.
5. Ratings and Reviews
Ratings and reviews are the voice of the customer on the digital shelf.
A product with strong ratings, detailed reviews, and positive sentiment is more likely to build confidence. A product with repeated complaints can lose conversions even when pricing and visibility are strong.
Review metrics should go beyond average star rating. Brands need to understand what customers are actually saying.
For example, a snack brand may see that customers love the taste but complain about damaged packaging. A skincare brand may discover that customers are confused about product usage. A kitchenware brand may find that negative reviews are mostly related to delivery issues, not product quality.
That kind of insight is valuable for more than ecommerce. It can help product teams, packaging teams, customer support, supply chain, and marketing.
Important review metrics include:
Average rating
Review count
Review velocity
Positive and negative sentiment
Common complaint themes
Product feature mentions
Competitor review comparison
Image or video review trends
Customer feedback is often messy, but it is honest. Brands that analyze it properly can find issues before they become larger reputation problems.
6. Assortment and Product Gap Metrics
Your products do not compete in isolation. They compete inside categories.
This is where Assortment Analytics becomes useful. It helps brands understand how their product range compares with competitors across marketplaces, categories, price bands, pack sizes, variants, and availability.
For example, a beverage brand may discover that competitors are winning with smaller multipack sizes on quick-commerce platforms. A pet food brand may find that competitors have more breed-specific options. A personal care brand may notice that a competitor has expanded into travel-size packs that rank well during seasonal periods.
Assortment metrics help teams identify:
Missing products in key categories
Competitor range expansion
Pack size gaps
Private-label competition
Regional assortment differences
Category white spaces
Price-tier coverage
Product duplication or listing errors
For category managers and enterprise decision makers, this is powerful. It shows not only how your current products are performing, but also where the market may be moving.
7. Buy Box and Seller Performance
For marketplace-led categories, seller performance can directly affect product sales.
On platforms like Amazon, multiple sellers may offer the same product. The seller that wins the Buy Box often gets the highest chance of conversion. If unauthorized sellers, third-party resellers, or low-performing sellers are winning visibility, the brand may lose control over pricing, customer experience, and product presentation.
Seller-related metrics may include:
Buy Box ownership
Number of active sellers
Unauthorized seller activity
Seller ratings
Fulfillment method
Price by seller
Shipping timelines
Seller stock status
This matters especially for brands with large marketplace exposure. A product may look healthy at the brand level, but seller-level data may reveal pricing inconsistencies, poor delivery promises, or reseller behavior that weakens brand value.
8. Retail Media and Sponsored Visibility
Organic visibility is important, but paid visibility is now a major part of ecommerce growth.
Retail media metrics help brands understand how sponsored listings, banner ads, promoted products, and paid placements affect digital shelf performance.
A brand may be spending heavily on retail media, but without proper measurement, it can be difficult to know whether that spend is improving visibility or simply covering up deeper issues like weak content or poor ratings.
Retail media metrics can show:
Sponsored vs organic visibility
Share of sponsored placements
Competitor ad presence
Keyword-level paid visibility
Category-level media activity
Campaign impact on product ranking
This helps ecommerce and marketing teams make better decisions about ad spend. Sometimes the solution is more media investment. Sometimes the real fix is improving product content, pricing, or availability first.
How These Metrics Work Together
The biggest mistake brands make is looking at digital shelf metrics separately.
Low sales are rarely caused by only one issue.
A product may have weak search visibility because it is out of stock often. It may have poor conversion because the content is incomplete. It may have lower ranking because reviews are weaker than competitors. It may lose clicks because the price is too high during promotional periods.
Digital shelf performance is connected.
Think of it like a store shelf. If the product is placed in the wrong aisle, has a damaged label, is priced higher than nearby competitors, and has limited stock, it will not sell well. Online, the same thing happens, but the signals are hidden inside data.
That is why brands need a connected view of search, content, price, availability, reviews, assortment, and seller activity.
Practical Use Cases for Consumer Brands
Digital shelf metrics are useful only when teams can act on them. Here are a few common ways brands use this data in real business situations.
Improving Product Visibility
An ecommerce team may track Share of Search for priority keywords across Amazon and Walmart. If a hero product drops in ranking, the team can check whether the issue is content, stock, reviews, or competitor ad activity.
Fixing Content Gaps Across Retailers
A brand may compare product titles, images, descriptions, and attributes across different retail websites. If a retailer is showing outdated or incomplete content, the team can correct it before it affects conversion.
Monitoring Competitor Pricing
Pricing analysts can track competitor price changes, discount patterns, and seller-level pricing. This helps them respond to market shifts without making rushed decisions.
Reducing Stockout Losses
Retail intelligence teams can monitor availability across regions and channels. If a product is repeatedly unavailable in high-demand locations, the team can work with supply chain or retail partners to improve replenishment.
Identifying Assortment Opportunities
Category managers can use assortment insights to see where competitors are expanding. If a competitor is gaining traction with new pack sizes, flavors, bundles, or variants, the brand can evaluate whether there is a real growth opportunity.
Protecting Brand Experience
Marketplace teams can track unauthorized sellers, Buy Box movement, inconsistent prices, poor content, and review issues. This helps protect customer experience across channels the brand does not fully control.
Benefits of Tracking Digital Shelf Metrics
The value of digital shelf measurement goes beyond reporting. It helps teams make smarter commercial decisions.
Better Visibility Into Online Performance
Brands can see what is happening across marketplaces and retailers instead of relying on isolated reports. This gives teams a clearer picture of product performance.
Faster Issue Detection
Stockouts, content errors, pricing changes, and seller issues can be identified earlier. That means teams can act before small problems become sales losses.
Stronger Competitive Intelligence
Brands can understand how competitors are pricing, promoting, positioning, and expanding their products. This helps with both short-term decisions and long-term planning.
Improved Conversion Rates
When products are visible, available, competitively priced, and supported by strong content and reviews, they have a better chance of converting.
More Confident Category Decisions
Category managers can use digital shelf data to improve assortment, identify gaps, plan launches, and understand market movement.
Better Cross-Team Alignment
Digital shelf metrics bring ecommerce, pricing, marketing, sales, supply chain, and category teams closer together. Everyone works from the same market reality instead of separate assumptions.
Where RetailGators Fits In
RetailGators helps brands, retailers, and ecommerce intelligence teams collect structured data from marketplaces, retailer websites, product pages, categories, sellers, reviews, pricing, and availability signals.
For consumer brands that want to improve digital shelf visibility, RetailGators can support data collection for pricing intelligence, product availability tracking, seller monitoring, product matching, review analysis, and assortment-level insights.
The goal is not just to collect ecommerce data. The real value is making that data clean, consistent, and useful for business decisions.
A pricing analyst may need competitor price movement. A category manager may need assortment gaps. An ecommerce manager may need content and availability checks. A leadership team may need a broader view of market performance.
RetailGators gives teams the data foundation they need to measure the digital shelf with more confidence.
How to Start Measuring Digital Shelf Metrics
If your team is just starting, do not try to measure everything at once. Start with the products, channels, and metrics that have the highest business impact.
A practical starting point looks like this:
Choose your priority products. Focus on top-selling SKUs, strategic categories, new launches, or products facing strong competition.
Select key channels. Identify the marketplaces, retailer websites, grocery platforms, or ecommerce channels that matter most for your business.
Define your core metrics. Start with search visibility, content quality, pricing, availability, reviews, and assortment gaps.
Benchmark competitors. Compare your products against relevant competitors, not every brand in the category.
Track trends over time. One-time data is useful, but trend data shows patterns. That is where better decisions come from.
Create action workflows. Decide who responds when prices change, content breaks, stockouts happen, or reviews decline.
The best digital shelf programs are not built only around dashboards. They are built around action.
Final Thoughts
Digital shelf metrics help consumer brands understand how products actually perform in the online buying journey. They show whether customers can find the product, trust the product, compare it fairly, and buy it without friction.
For ecommerce managers, pricing analysts, category managers, and retail intelligence teams, this visibility is now essential. The digital shelf changes too quickly for manual tracking or delayed reporting.
The brands that perform well online are not always the ones with the biggest budgets. They are often the ones that measure the right signals, spot problems early, and act before competitors take the advantage.
A product page may look simple from the outside. But behind every click, ranking, price, review, and stock status, there is a signal. The brands that learn to read those signals will make better decisions — and win more often on the digital shelf.


Comments